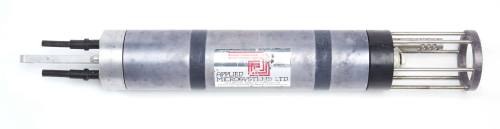
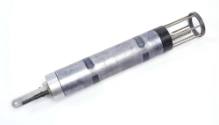
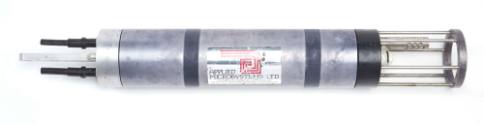
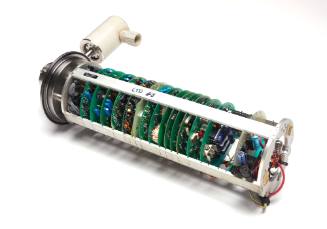
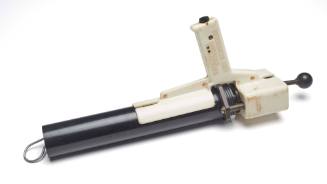
Conductivity Temperature and Depth Profiler
Dateafter 1974
Object number00055915
NameCTD Profiler
MediumMetal, Plastic
DimensionsOverall: 783 × 99 mm
ClassificationsTools and equipment
Credit LineAustralian National Maritime Museum Collection Gift from Defence Science and Technology Group
Collections
HistoryThere are smaller, low-powered versions of CTD sensors that are used on autonomous instruments like the moored profiler, gliders, profiling floats and AUVs. However, these recordings can be less precise if they lose calibration while being deployed for a long time. Unlike the packaged ship deployments, they don’t benefit from being cross-referenced with water samples taken at the same depth as the sensor recordings.
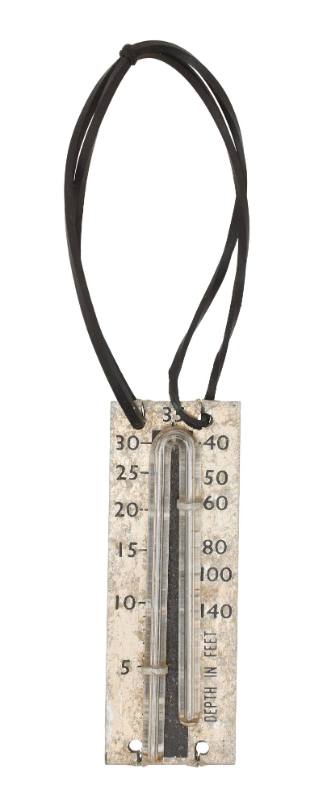
Bruce Hamon was the first physical oceanographer appointed to the CSIRO. In the early 1950s, he began work on the first CTD (conductivity, temperature and depth) recorder. Early designs were based on radio valves and met with limited success. Further development in the United States in the following decades saw refinement of the design, but it was slow to be adopted in Australia given limited staff and vessels. In September 1956, the Hamon/Brown Salinity-temperature-depth recorder was lowered into the water by crane for the first time during a research voyage on the Derwent on RV Derwent Hunter.
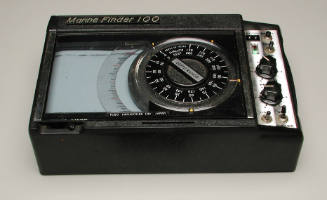
In the interim, salinity was measured by portable temperature-salinity bridge and inductive salinometer (represented in the collection, donation from DSTG). The portable bridge used conductive cells in seawater.
The salinometer (post 1958) was designed by Neil Brown. The first two were made in 1958. The overall design used an inductive cell for temperature compensation to allow for high accuracy without temperature control.
Water samples were analysed in the CSIRO Cronulla laboratory and transferred to the Data Processing System. Before 1951, this was represented by one woman and increased to three women, titled Technical Assistants, by 1954. Chlorinity was converted to salinity using a 3 x 2 foot Masonite-baced nomograph and yard-long cursor. Density was read from a slide rule after the temperature and salinity figures were recorded. Oxygen equivalent was read from thiosulphate strength and titration value. The phosphate figure was obtained by conversion using Freidan and Marchant calculating machines.
After the 1970s, the CTD (abbreviated) was designed as an electronic instrument that measures very accurate, nearly continuous profiles of conductivity, temperature, and pressure (depth) in the water column. The CTD measures the saltiness of the ocean (conductivity) which allows for conclusions to be drawn such as the density of the water tested. CTDs are packaged with other sensors and attached to a water sampling setup like a metal rosette in contemporary use. This is deployed into the ocean using a conducting cable through which the real-time measurements are transmitted to a recorder/computer on the ship. Today there are also self-contained instruments (i.e., with an internal memory). Salinity is computed subsequently from the conductivity and temperature measurements. Accuracies are typically ±0.005 psu, 0.005 K, and 0.15% full scale for conductivity, temperature, and depth, respectively.
SignificanceScientists can use this data coupled with the temperature and depth recorded, to understand different masses of water in the ocean and how they move about the planet. Temperature and salinity affect the density of bodies of water and this can cause two sections of layered water to travel in different directions. Climate change is affecting the properties of seawater and using a CTD alongside other developed sensors can indicate changes in the ocean over time.
1960-1989